Built for operators who own the number.

Manufacturing, mining and logistics come first: their hero sets are built on operating logic from all three. Construction and retail follow on the same architecture. The pillars don’t change. The field names do.

Model set built

Manufacturing

Single or multi-line plants where capacity, downtime and product mix decide the month. Installs usually start at the Production & OEE Command Centre, because the downtime Pareto settles an argument nobody has settled with opinion.

Hero installs

  • Production & OEE Command Centre: availability, performance and quality losses, daily, by line and shift.
  • True Cost-to-Produce Engine: SKU economics for pricing and mix decisions.
  • GM Control Room Dashboard (E02): the executive overlay with RAG status and owners.

Hero installs are Control Room configurations, assembled from the catalogue and set up in your industry’s field names.
Model set built

Mining and resources

Sites where production sits in dispatch, grade sits in the lab and cost sits in finance, and nobody sees them together in time to change the month. We stitch the three sources and build the reconciliation in.

Hero installs

  • Mine Operations Performance Engine: tonnes, grade, recovery and equipment availability in one daily view.
  • Cost per Tonne Sensitivity Engine: drill, blast, haul and process cost by stage, with fuel and utilisation sensitivity.
  • Equipment Downtime Pareto: ranks the units actually costing you availability.

Hero installs are Control Room configurations, assembled from the catalogue and set up in your industry’s field names.

You don’t need perfect data. You need these fields.

The minimum viable dataset for mining, published in full rather than drip-fed on a call. If a field is missing we build around it. A partial dataset still produces a working cost-per-tonne view.

Download this specification (PDF)

1. Production, per shift or per day
FieldFormatExampleRequiredNotes
DateDD/MM/YYYY03/02/2025Yes 
ShiftTextDay / NightYes 
Area / pit / stopeTextStage 4 CutbackYesConsistent names
Tonnes mined (t)Decimal4,820YesBCM or tonnes
Tonnes processed (t)Decimal4,510NoIf milled
Head grade (g/t or %)Decimal1.42YesFrom assay / ROM
Recovery (%)Decimal 0–10.91NoProcessing recovery
2. Equipment hours and availability
FieldFormatExampleRequiredNotes
DateDD/MM/YYYY03/02/2025Yes 
Equipment IDTextEX-04 / HT-12YesMatch fleet system
Operating hoursDecimal18.5YesPer day
Available hoursDecimal22.0YesScheduled
Downtime hoursDecimal3.5YesUnplanned + planned
Downtime categoryTextMechanical / TyresNoDrives the Pareto
3. Cost inputs, per period, weekly or monthly
FieldFormatExampleRequiredNotes
PeriodMMM-YYYYFeb-2025Yes 
Diesel / fuelCurrency182,000YesAU$
ConsumablesCurrency94,500YesExplosives, GET, etc.
LabourCurrency210,000YesAU$
MaintenanceCurrency76,000NoAU$
Total tonnes for periodDecimal118,400YesFor cost per tonne

Acceptable sources

Shift reports and daily production sheets; a fleet management or dispatch export; assay lab grade data; the cost ledger or month-end cost report. CSV or Excel, one row per record.

Frequency

Production and equipment per shift or daily, or an 8–12 week batch for the build. Grade per assay batch. Cost weekly or monthly.

“We don’t have clean data”

Mining data is rarely tidy and almost never in one place. Split across dispatch, the lab and finance is the normal starting point, not a disqualifier. The reconciliation between them is part of what we build. This specification exists so you can start before your data is perfect.

Hero set built

Logistics and distribution

Distributors and carriers where the blended OTIF looks fine and one lane quietly fails. The two heroes answer the questions that decide a contract renewal: where delivery breaks, and which lanes and customers actually make money.

Hero installs

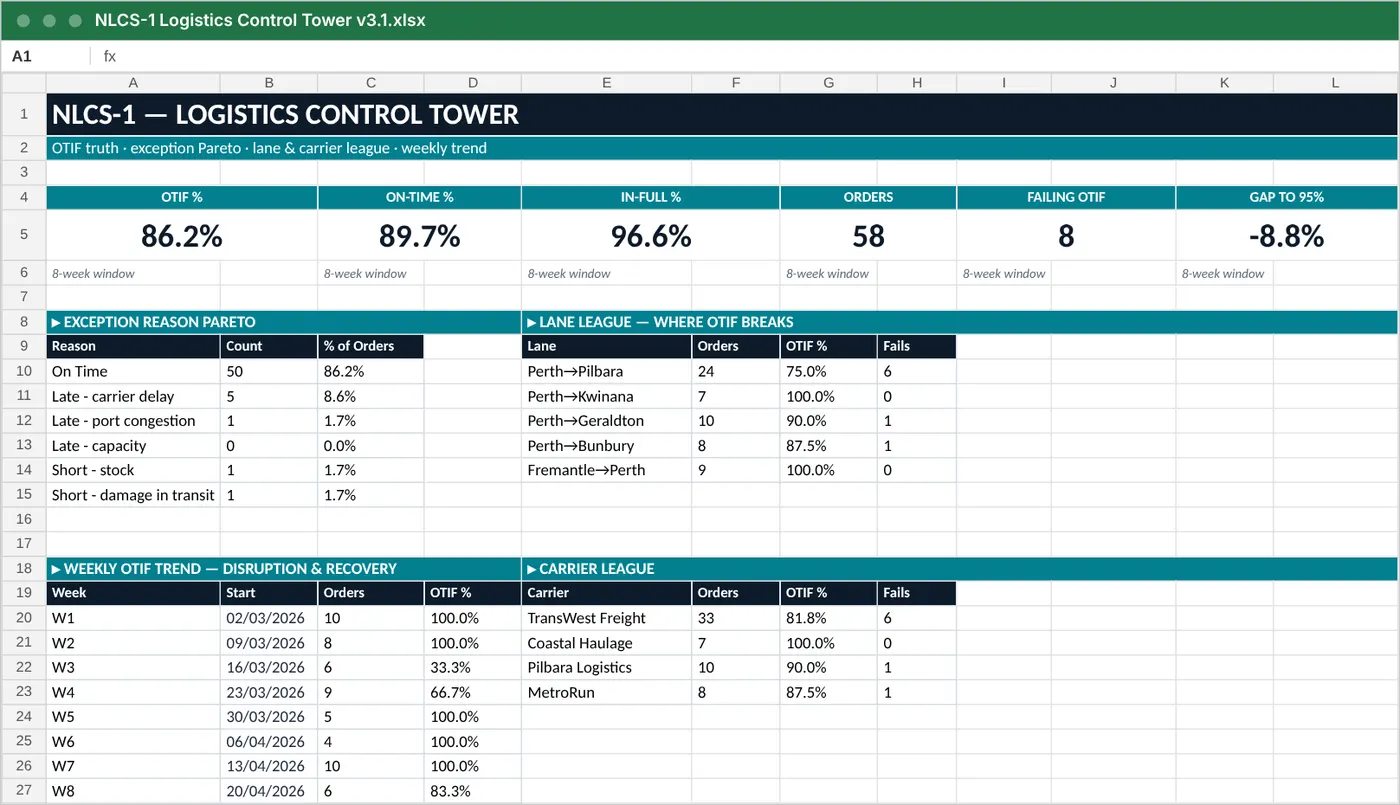
  • Logistics Control Tower: OTIF by order, exception Pareto, lane and carrier league, weekly trend.
  • Freight Cost & Margin Engine: freight as a share of revenue, margin by lane and customer, and expedite leakage isolated.
86.2%OTIF against a 95% target
75.0%OTIF on the worst lane, Perth to Pilbara
41.8%freight share of revenue, target 30%
AU$4,655illustrative expedite premium, 8 weeks

Figures from the demo dataset in the workbook shown, a fictional Perth distributor. The lane failing OTIF is the same lane leaking freight margin: fix it once.

Excel dashboard of the Logistics Control Tower showing OTIF 86.2% and the lane league.
The Logistics Control Tower dashboard, v3.1.

Next: construction and retail.

Same five pillars, same governance, same install pattern. Only the field names and the hero installs change.

In build

Construction

Project control plus project profit and cash flow, with claims and variations tracked against the programme.

In build

Retail

Trading command centre plus pricing and promotion effectiveness, measured against baseline rather than last year.

Available now

Something else?

The 32 operational models are cross-industry. Score your control first and we will tell you honestly whether a model set fits.

Want to see the lead model for your sector?

Tell us your industry on the call and we demo the model that matches your lowest-scoring control gap, using your field names, not ours.